Sharpe ratio breakdown
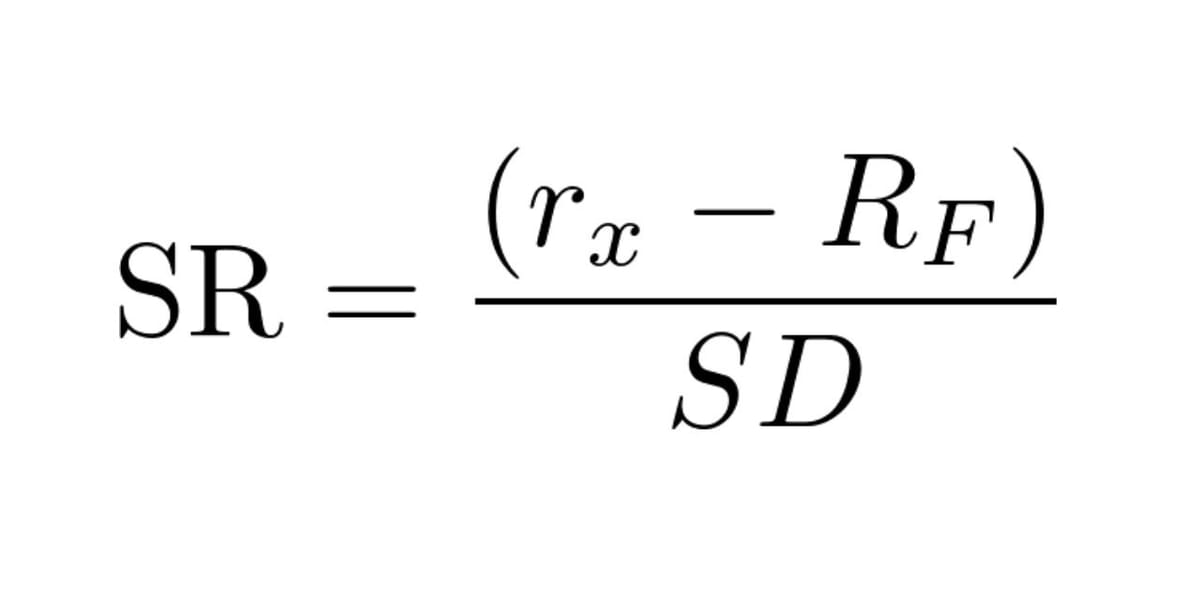
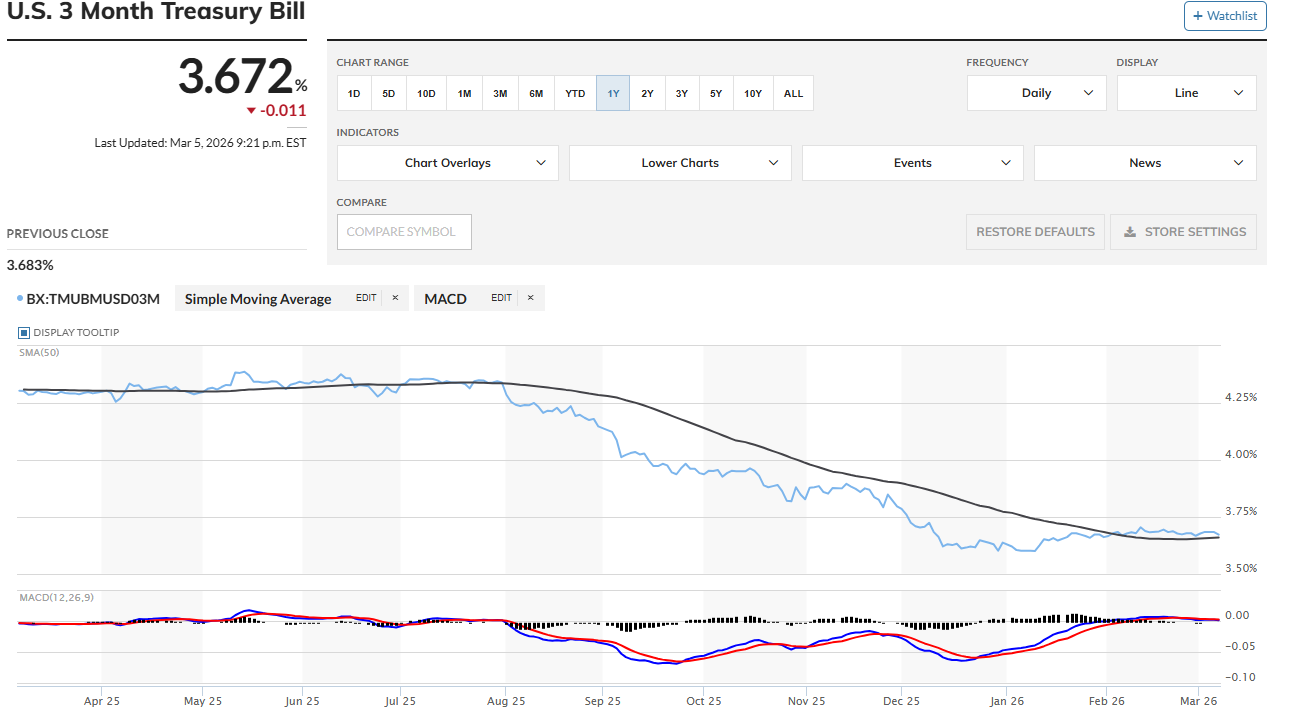
Usually, I don't write about math or equations for the reason of the sheer volume and implications of each one. Special equations do stand out, and I think it is important as a retail investor to understand the Sharpe ratio at least on a fundamental level. William Sharpe made the Sharpe ratio in which it measures the performance of a security relative to a risk-free asset, adjusting for risk. Simple terms it means how much return am I getting for the risk I am taking. Now what does all of this mean? Starting off with rx which simply is the expected return of the security or portfolio (this writing will be about individual securities) and the expected return is basically what it says what do you expect. Flipping a coin is 50/50 so you expect it to be heads half the time. Buying the S and P you expect around 7% on your investment annually. Next is Rf and this means risk free which for this writing and majority of investment models the 3-month T-Bill is considered the Rf rate due to the short-term maturity (debt is safer in shorter periods) and it's backed by the US government which most likely won't default in 3 months. 3-month t bills are about as risk free as you can get other than inflation risk (meaning your returns are being ate by inflation) but it is not really a big deal with such a short-term debt.
Now the part that's not as simple and that is the standard deviation or SD which is a common proxy for risk in the finance world. Finding the standard deviation sounds complicated but it is not let's take a look. Stock A has presented these returns over the past three years 10%,2%, and 14% so we take these and find the arithmetic average or geometric (depends on timeframe) which ends up being 8.67%. Next up we take all of our returns and figure out the amount deviated from the mean which basically means how far away did it move from average so the answers would be 1.33, -6.67, and 5.33 which I just did Yearly returns - mean. Now we square these deviations to work towards our variance so the answers would be 1.77, 44.49, and 28.41 all over n which is 3 (time). Variance equals 24.89 and now to get SD we simply take the square root of variance hints o2= variance and o= SD so we end up getting 4.99. 4.99 means that returns vary from the mean 4.99% of the time. Combining all of these together we get the Sharpe ratio and figure out what your return is for how much risk you are taking on. Let me show you the Sharpe ratio for Rocket Lab: RKLB. Assuming rx is found using CAGR (Compound Annual Growth Rate) maybe another day it will get an article but, lets focus on Sharpe right now LOL.
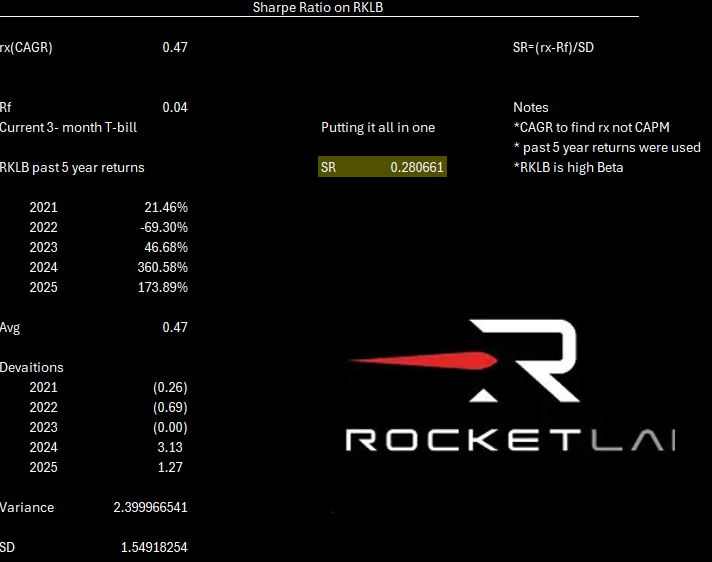
Okay now what? Well, we can see above RKLB has a Sharpe Ratio of about .280661. Now you are probably curious on what exactly that number means. The Sharpe ratio essentially is how much units of return are you getting with taking on 1 unit of risk. RKLB has a low Sharpe ratio but still earning more than a risk-free asset per unit of risk. Units are just a measurement so basically one unit of risk, one unit of volatility, .... it can keep going on. RKLB provides .28 units of return for every one unit of risk which is not that good. Like always this is not the only thing you should look at but definitely something to think about as you are earning relatively low return when you think about the risk you are taking on holding RKLB. Quick side note top hedge funds look for around 1-2 on the Sharpe ratio. Sharpe ratios will make you think and are very interesting especially when you move away from just doing one security and do a whole portfolio which gets a little bit more complicate but not too bad. Simple terms on the Sharpe ratio if you are still a little bit of confused it basically defines a securities return based on the risk you take. Say a car is driving and each MPH is a unit and the risk on that is defined by the Sharpe ratio so for every unit of risk you get this return (.28) from our example which is not a good return so the driver would be wise to not go fast (not buy the stock).